Background
The First Model
The first model is based on the level of transmission of the virus. Increasing the level of social distancing can lead to a lower infection rate. This can greatly improve outcomes in terms of not exceeding the hospital maximal capacities. This model is based on the SIR (Susceptible, Infected, Recovered) model of the spread of the virus. This comes from a series of differential equations that –when solved– yield three different graphs, as shown above.
The Second Model
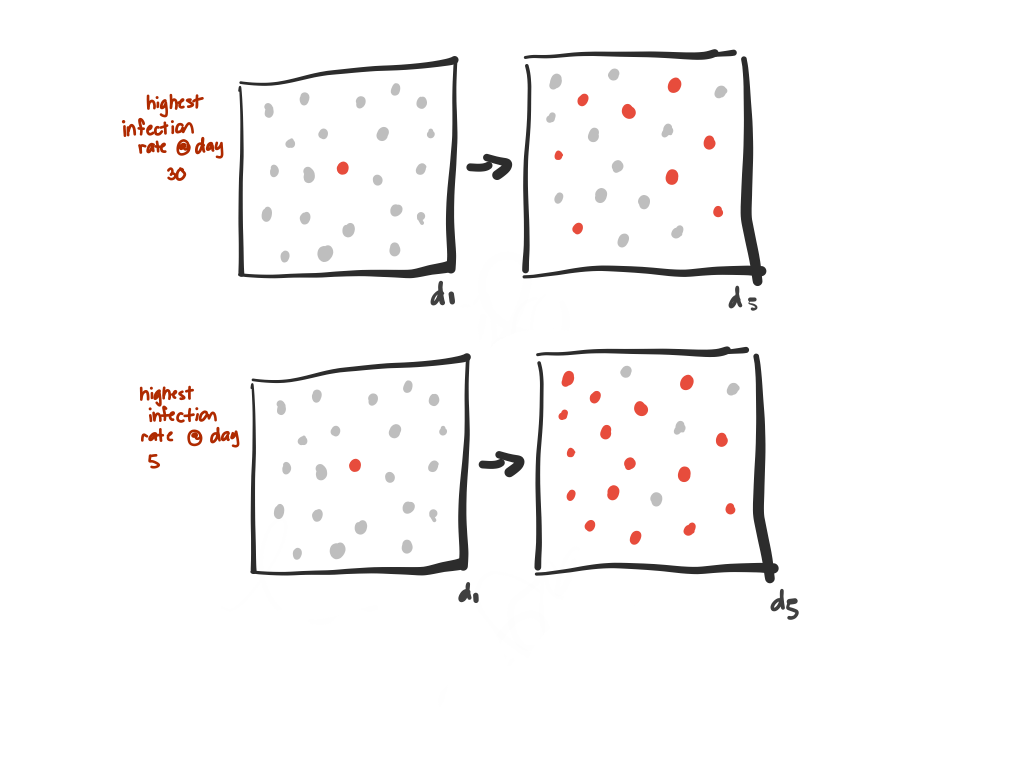
The infection rate determines how many more people are infected from a source as a function of time
Knowing around when this max growth rate occurs can help us model when the curve will flatten out.
This model is based on a Logistic Growth model, which is often denoted by the equation: $P(t) = \frac{L}{1 + ae^{-bt}}$.
Here, $L$ is the maximum number of people predicted to be infected. $a$ is a constant that is derived from the initial condition (the number of reported cases on March 1st). The growth rate constant, $b$ can be derived from knowing when the maximum growth rate occurs. $P$ is the total number of reported infected individuals. As of now, we don’t have enough data to exactly know when this inflection point will occur.