Prostate Nomogram Application
An app to predict probability of biochemical failure for prostate cancer
Background
Prostate cancer is diagnosed in over 150,000 men every year. With current advances in therapies, patients have longer life e expectancies and prognoses. In 2013, Stoyanova et al developed a nomogram based on machine learning algorithms for predicting the probability of biochemical failure of prostate patients based on key parameters. They are:
-
T-Category
- T1: The tumor is not detectable with a digital rectal exam (DRE) or imaging but is found in prostate tissue from a biopsy or surgical treatment.
- T2: The tumor is detectable with a DRE or imaging but is confined to the prostate.
- T3: Cancer has grown outside the prostate and may have grown into the seminal vesicles.
- T4: Cancer has grown into other nearby tissues, such as the urethral sphincter, rectum, bladder or wall of the pelvis.
-
Gleason Sum

-
Percent GP 4/5 Percentage of tumor cells with a Gleason pattern of 4 or 5
-
RT Dose The radiotherapy dose measured in Grays
-
PPT Percentage of biopsy tumor that was positive for adenocarcinoma
Original Nomogram
The original nomogram was developed in 2013 by Stoyanova et al. Below you will find an image of the orginal

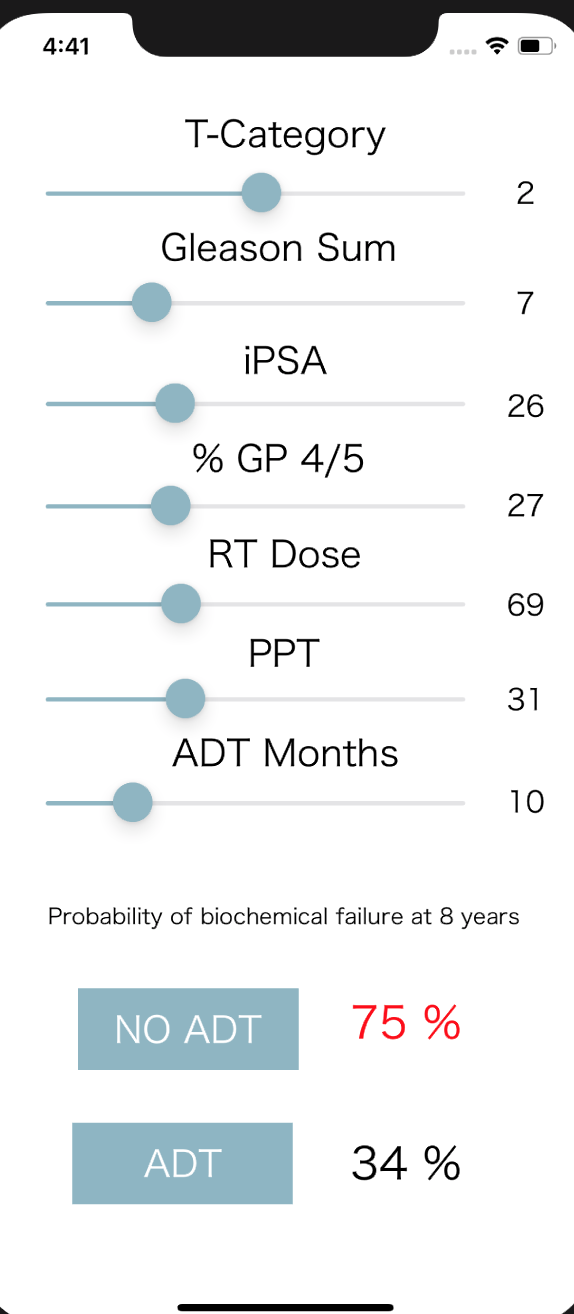
The Digital Application Version
Our app takes the analog version of the nomogram and makes it digital. It is based on a series of regressions from the analog version. Below find an image from the interface.
iOS Version
[//]: # ( #### HTML Web Version) [//]: # (
Prostate Nomogram for Biochemical Failure
Enter Your Information
All fields are required unless noted optional
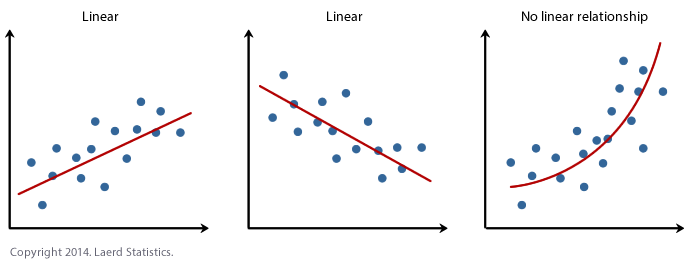
The Digital Backend
The backend is based on a series of regressions done in Excel. Please find an example image below.