In Excel
When normalizing data in Excel, it is good to distinguish and clearly mark your sample groups.
Here is a step by step guide for finding the Fold Change, a form of normalization used especially in genetics.
Fold Changes
Find the average expression/concentration or whatever unit of analysis for the control (or any other reference group) for each gene (could be lipid or metabolite). Record both the average and standard deviation. Divide each individual sample for each gene/lipid/metabolite by the averages of the reference classes. Now your data is normalized!
Percent Difference
Find the average expression/concentration or whatever unit of analysis for the control (or any other reference group) for each gene (could be lipid or metabolite). Record both the average and standard deviation. For each gene/lipid/metabolite for each sample, subtract the average concentration or expression value of the reference sample mean from the test expression data. Now you’ve normalized it by percent difference!
In Metaboanalyst
When normalizing data in Metaboanalyst, the process is much simpler
- Sample specific normalization (i.e. normalize by dry weight, volume)
- Normalization by the sum
- Normalization by the sample median
- Normalization by a reference sample (probabilistic quotient normalization)3
- Normalization by a pooled or average sample from a particular group
- Normalization by a reference feature (i.e. creatinine, internal control)
- Quantile normalization
Here’s a rundown:
- Upload a CSV file of your data. You can easily save excel files into CSV by “Saving As”
- Make sure to specify whether your data is in columns or in rows
- Choose your preferred method of normalization.
- Transform your data. The most common method is log-transformation.
- You can optionally scale your data. This is often done when trying to find the Z-score of your data.
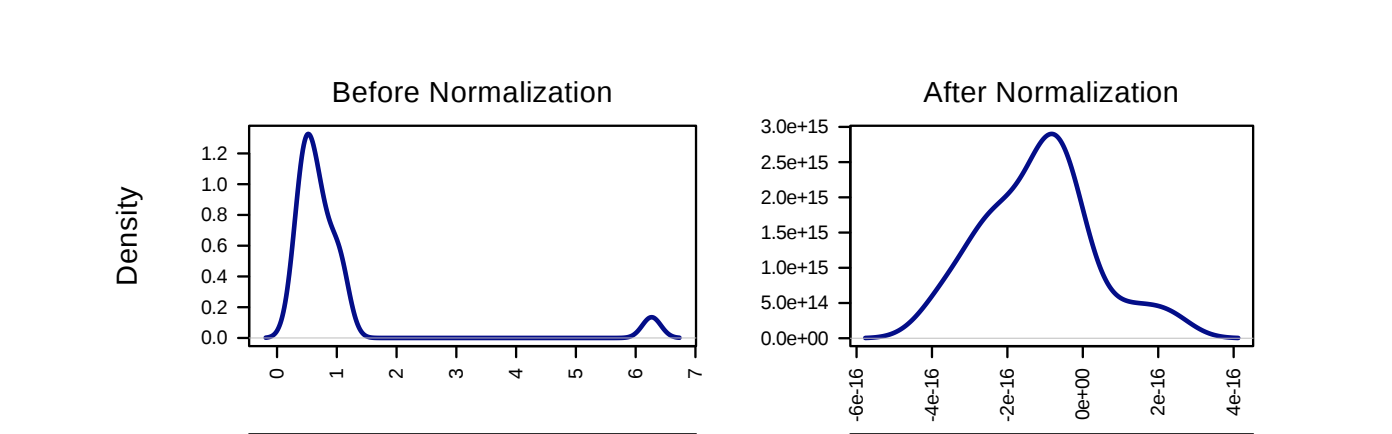
Why do we normalize and transform?
Mathematically, we expect to see a normal distribution of lipids/genes/metabolites. To achieve this, we often have to normalize and transform the data. Below is a demonstration of data before and after normalization: