Generating networks typically involves either using experimental data, literature searches, or a combination of both. There are two methods previously used to generate interaction networks: OmicsNet and the MetsCape Cytoscape Application.
OmicsNet
OmicsNet is a web-tool used to generate interaction networks based off databases documenting protein-protein, protein-metabolite, and miRNA-protein interactions. You will first need:
- A list of proteins (genes) that has been converted into Entrez IDs (Use the UniProt retrieval/ID mapping tool). The logFC is optional, but will help generate expression networks. These can either be found experimentally or in the literature.
- There’s an option to list the genes as Knockouts (KOs)
- (Optional) A list of metabolites (as Kegg IDs). These can either be found experimentally or in the literature.
- (Optional) A list of transcription factors (Entrez IDs)
- (Optional) A list of miRNAs
You can also upload whole network files as either .sif or .graphml files.
Upload the data into each respective box. Click “proceed”
You are then taken to a page that looks something like this:
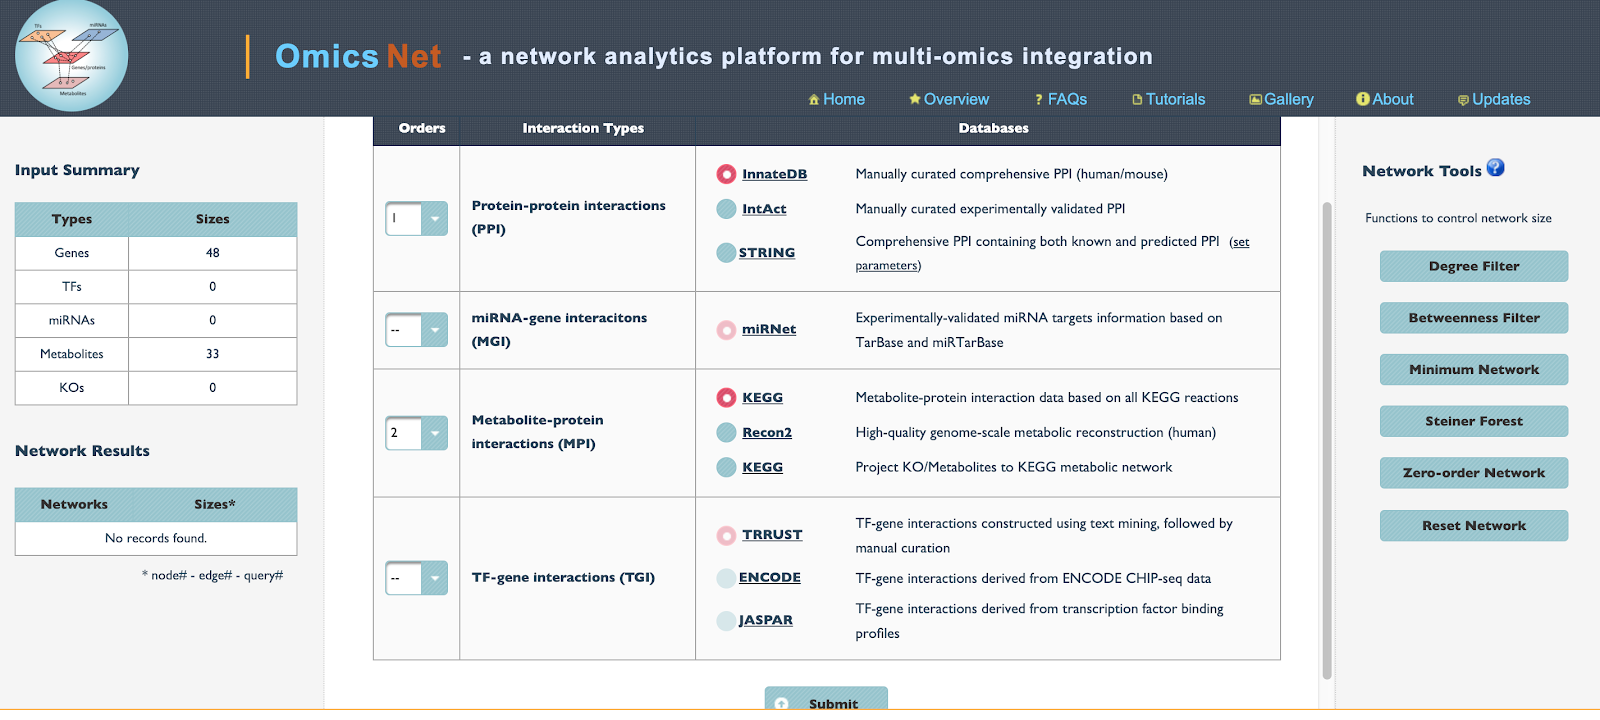
- The left hand corner shows the number of Genes, Transcription factors, mRNAs, metabolites, and KOs (knockouts) identified.
- The “Orders” number indicates which type of interactions take priority when constructing the network.
- The options for which method (database) to use to construct the network interactions is next.
- Note if you have a large network (i.e. > 200 nodes) It is wise to click the “minimum network” button to generate a smaller network with the most important interactions.
- Click “Submit”
- Sometimes, a popup will appear to indicate if you want to expand the primary PPI network to include secondary proteins that target either the primaryClick on the Network tab in Cytoscape. Then click “Style” Click “Label” and click “Shared name” Click “Shape” click “Discrete mapping” assign different shapes to the type of node. I.e. gene, metabolite, etc. Go to “edge”, click “label” and delete the label Save the network as a PDF by clicking the arrow button. seed nodes, the primary seed nodes and other nodes, and any node. Depending on how comprehensive you want the network to be, pick the option you think is best.
- Then click “Proceed”
Here is an image of the next page:
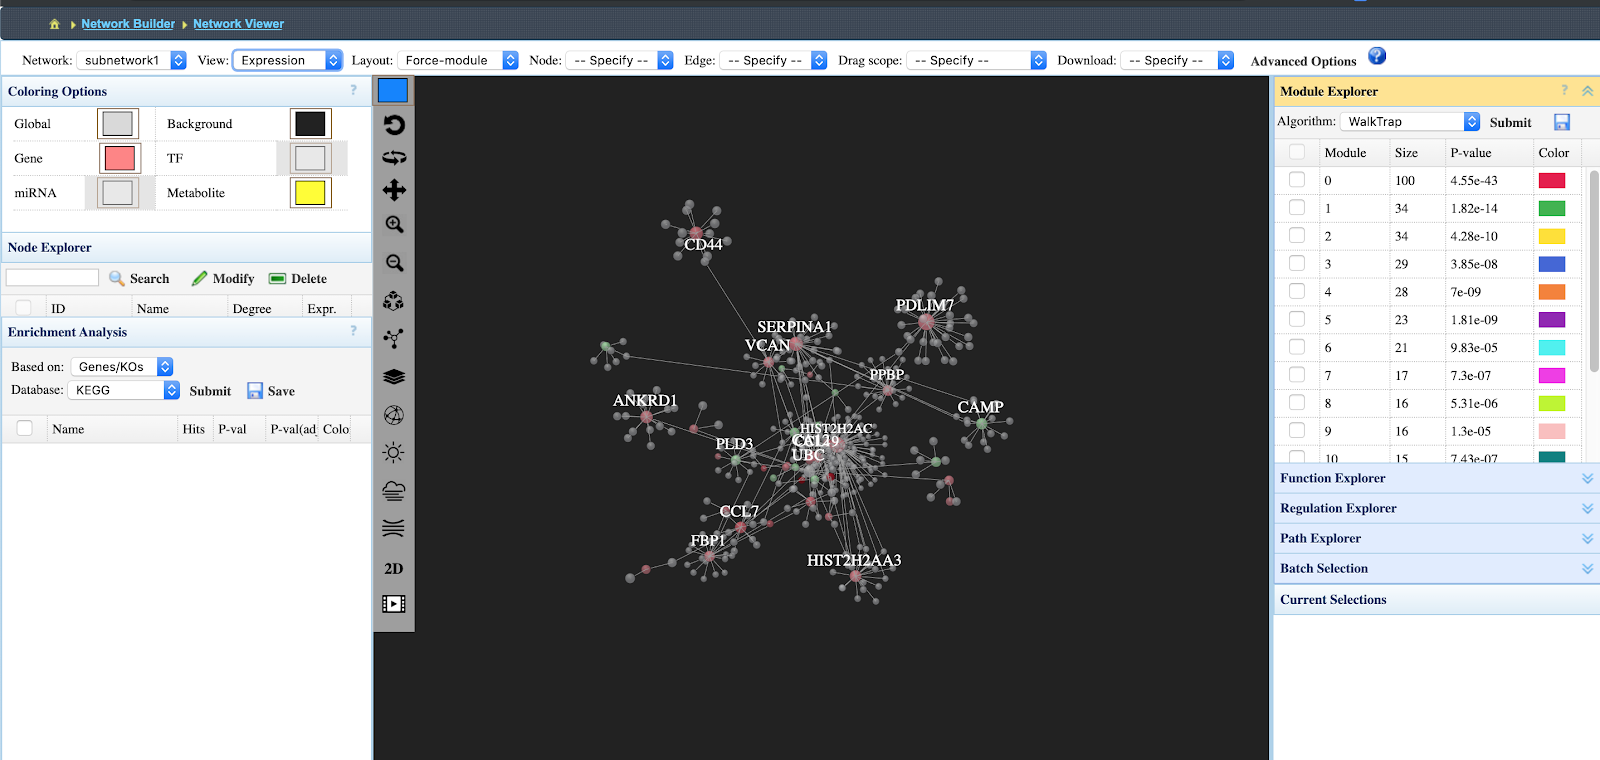
- In order to view under and overexpression of the proteins/metabolites click View “Expression”
- You can download the network as either a 3D gif, a .graphml or .sif file that can be uploaded to Cytoscape, etc.
- The right bard indicates the interaction networks that are of high significance.
- To generate a 2d network with all node labels, download the network as a .graphml file
- Import the network into Cytoscape
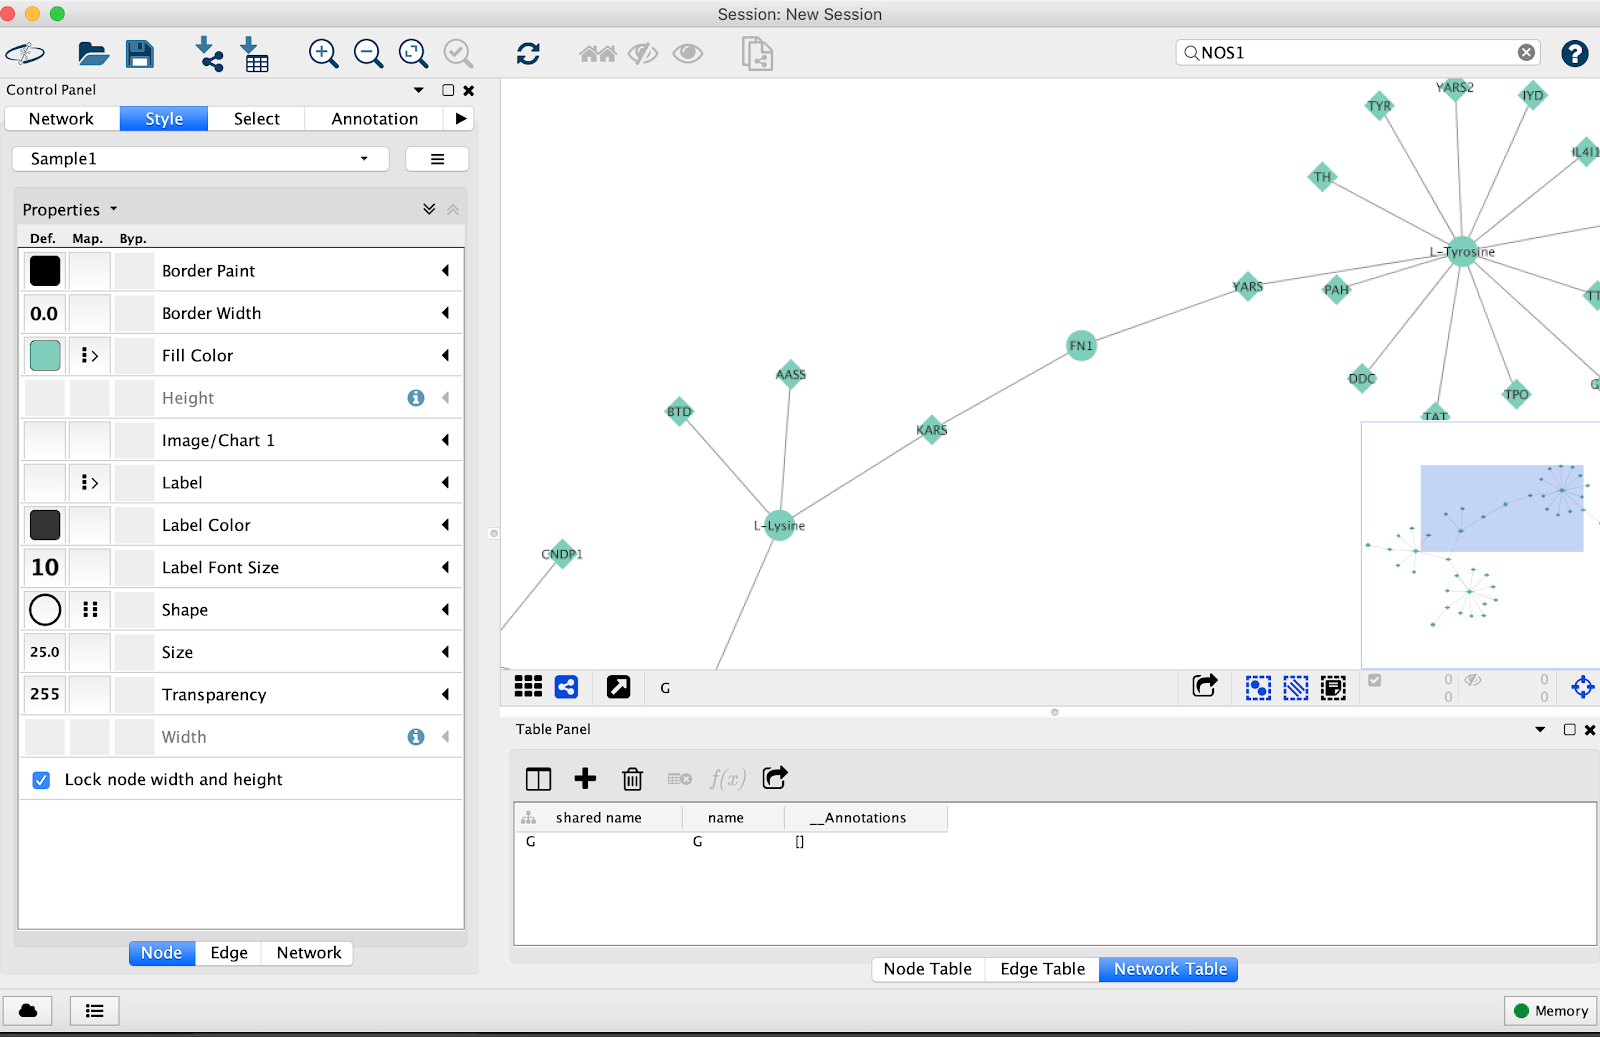
- Click on the Network tab in Cytoscape. Then click “Style”
- Click “Label” and click “Shared name”
- Click “Shape” click “Discrete mapping” assign different shapes to the type of node. I.e. gene, metabolite, etc.
- Go to “edge”, click “label” and delete the label
- Save the network as a PDF by clicking the arrow button.
MetScape
Metscape is specific to enzyme interactions between metabolites and proteins. It uses an in-house database to map interactions.
- Download MetScape by opening Cytoscape, Apps, AppManager, locate MetScape and install.
- Open MetScape in Cytoscape
-
- Locate the Kegg IDs of the metabolites of interest.
- Put them into their respective boxes (genes or compounds)
- Note: MetScape may not accept all the IDs. That’s because it only accepts genes/metabolites involved in enzymatic reactions. I.e. Structural proteins are not accepted.
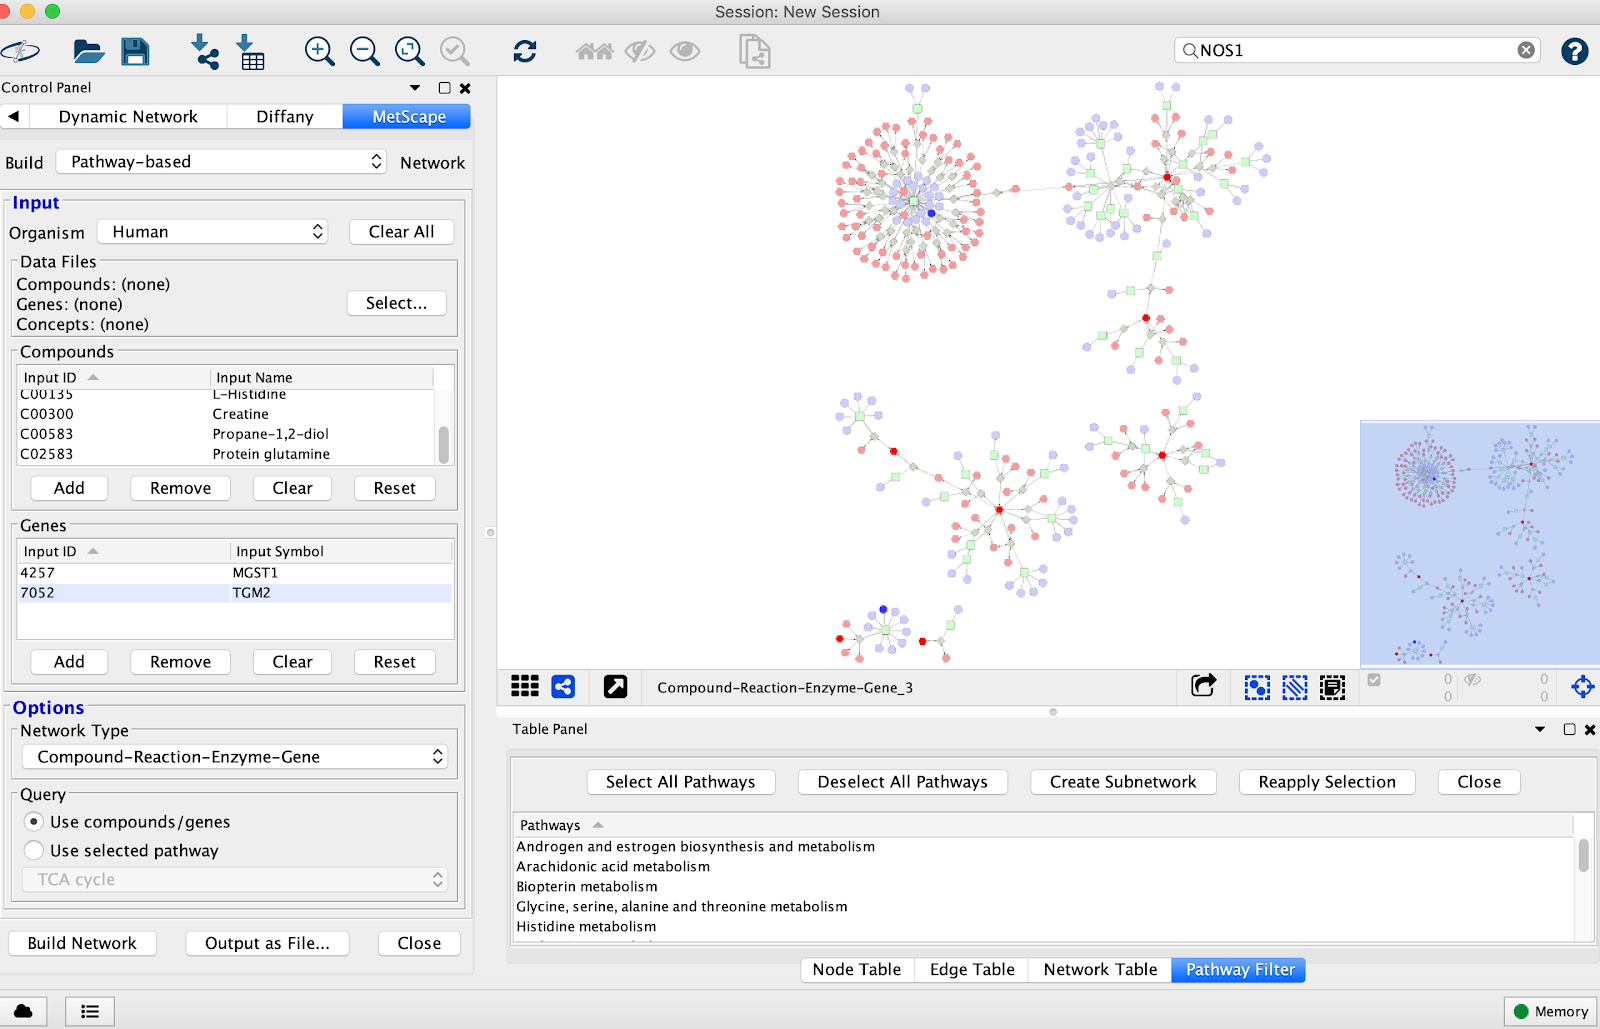
You have the option of picking
- Compound-Reaction-Enzyme-Gene
- Compound-Gene
- Compound-Reaction
- Compound
Save the network as a PDF by clicking the arrow button.
DyNet Analyzer
Sometimes it’s useful to look at the differences and similarities between multiple networks. This can be done with the DyNet Analyzer
- Download DyNet Analyzer by opening Cytoscape, Apps, AppManager, locate DyNet and install.
- Upload the networks of interest for comparison using the “DyNet Network Importer” tab under “Apps”
- Click “DyNet analyzer” and highlight the networks you want to compare.
- You have the option under “advanced options” for picking different variables to analyze for similarity i.e. reaction, compound name, etc.
- You should then get a screen that looks like this:
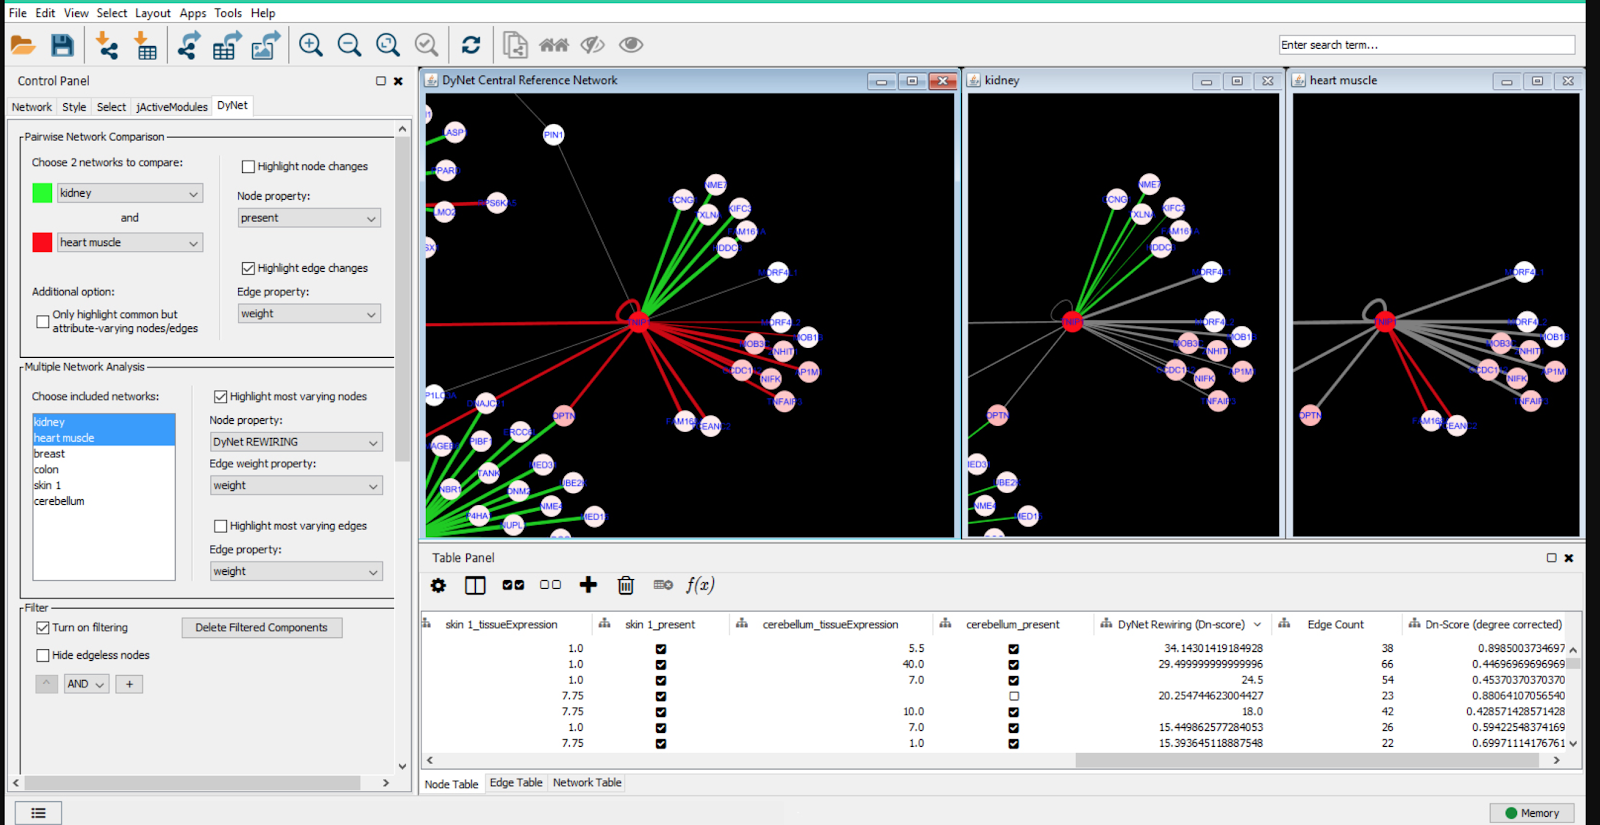
The green and red indicate individual distinct networks and grey/white represent overlapping networks.