When we analyze data, one of the key things we look for is significant differences in expression values and fold changes. Because we are often dealing with samples and not population data-sets, we often employ the student t-test. There are two main types of t-tests used in bioinformatics: two independent sample t-tests and paired sample t-tests. We can use the p-values generated from our t-tests to further develop volcano plots.
T-Tests
Two independent samples
When we are working with two different sample groups that are independent of each other, we often use the two independent samples t-test. The way it works is that the means and pooled standard deviations of both groups are computed and then plugged into a formula to calculate a t test statistic. Depending on the degrees of freedom (df = N1 + N2 - 2), the t test statistic corresponds to a test statistic in the t distribution table. If the t-calculated is less than the t-table at the corresponding df and alpha value (often 0.05 is used), we can reject the null hypothesis and say that there is a significant difference between the two groups.
Paired samples
We often do paired sample t-tests when the control and test conditions are actually the same sample. A good example is seeing a patient’s response to a drug (say avastin). The control case is the patient’s health before the drug and the test case is the patient’s health after the drug. The df are N - 1.
The easiest way to do this is in Excel:
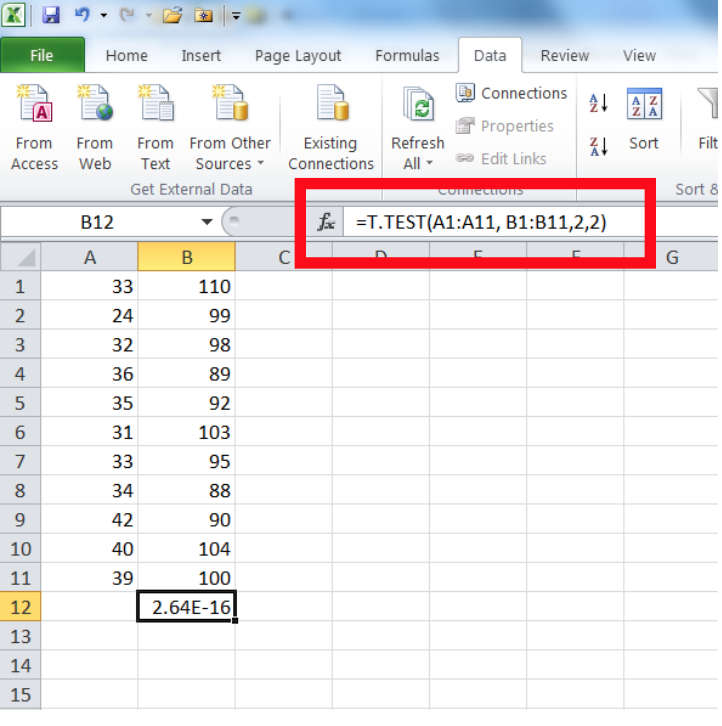
Here, array1 refers to the first set of data (A1:A11 in the example at left), array2 is the second set of data (B1:B11), tails refers to whether you want to run a one- or two-tailed test (in the example at left the number 2 is entered, indicating a two-tailed test; it would be 1 for a one-tailed test), and the type refers to:
1 = paired test
2 = two sample equal variance test
3 = two sample unequal variance test
The value returned from this formula is your p-value (2.64E-16 in the example at left, the same as was calculated above).
Volcano Plots
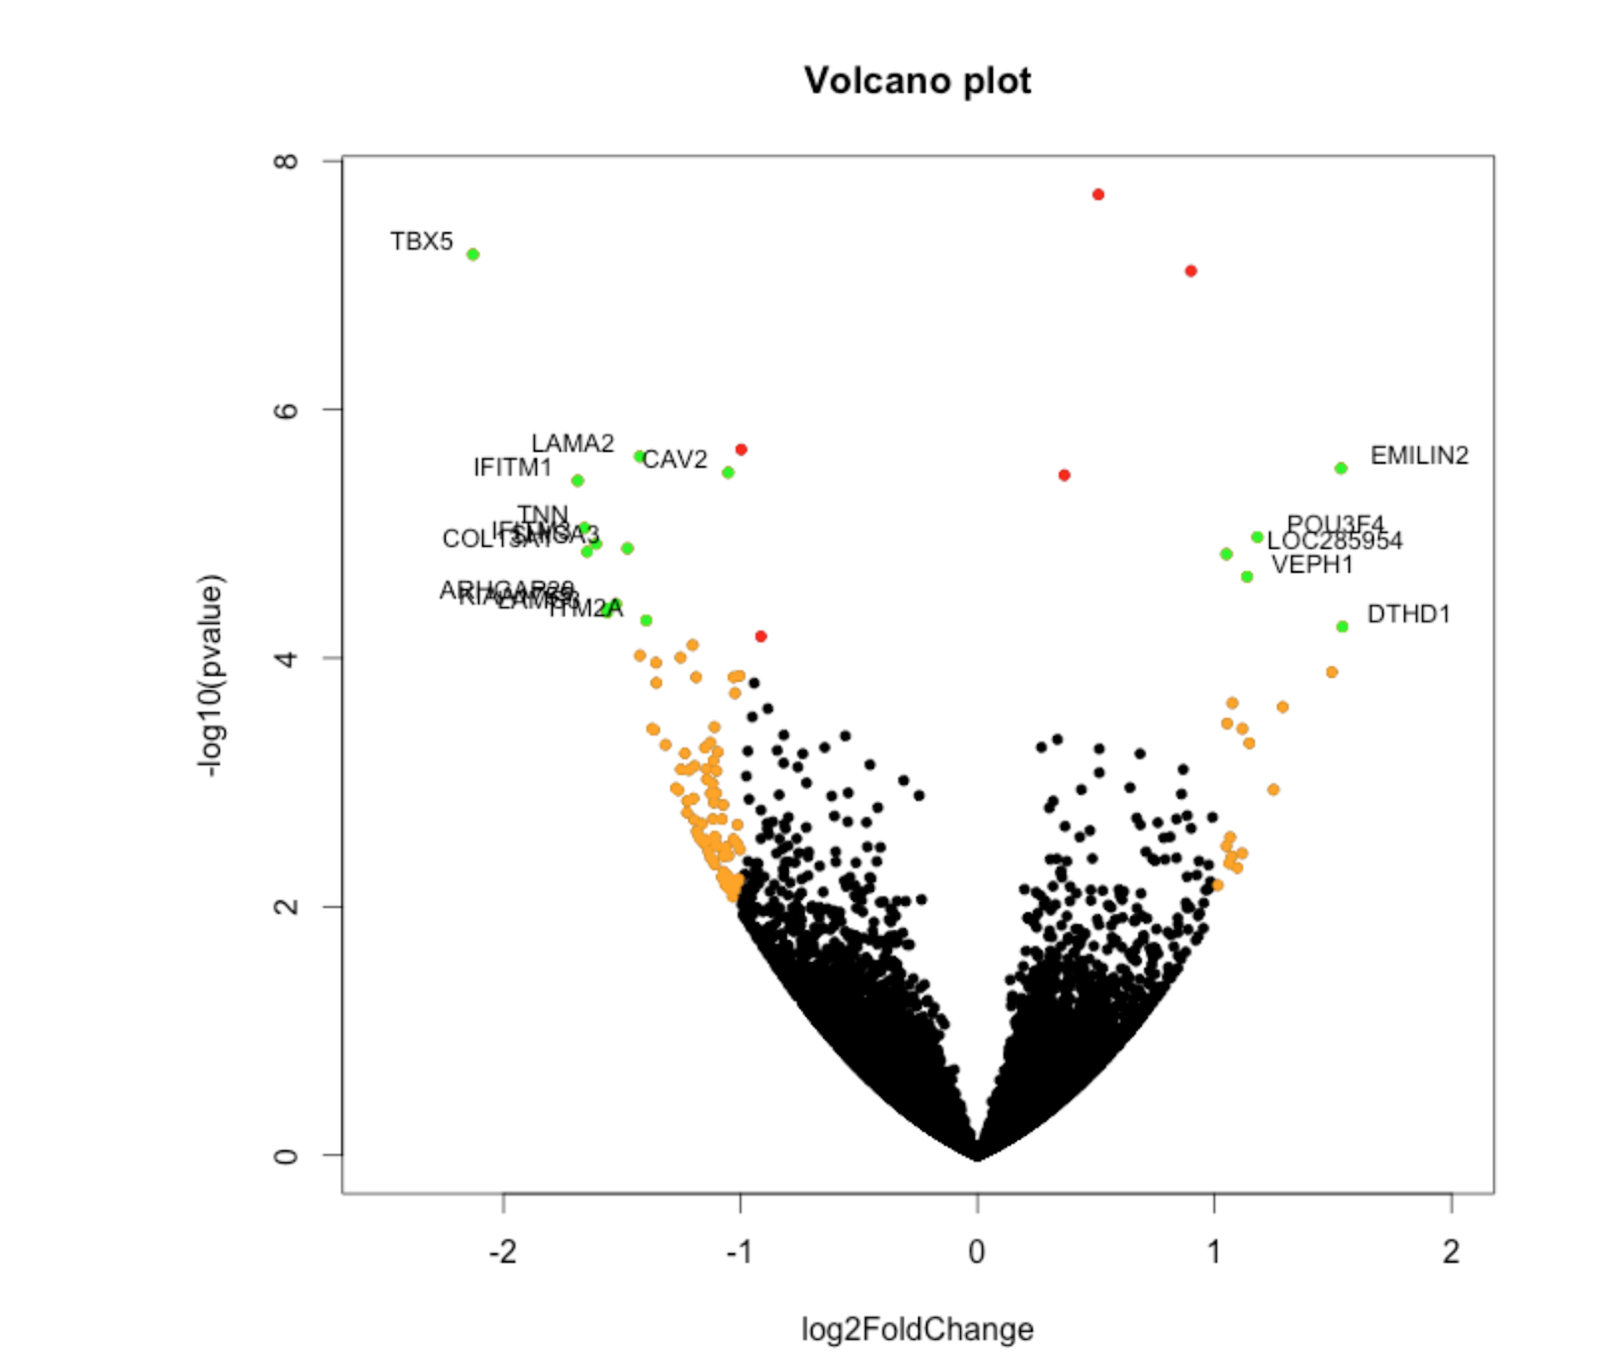
Generating volcano plots is easy to do in R. Volcano plots often plot the log(Fold Change) vs log(p value).
![]()
-
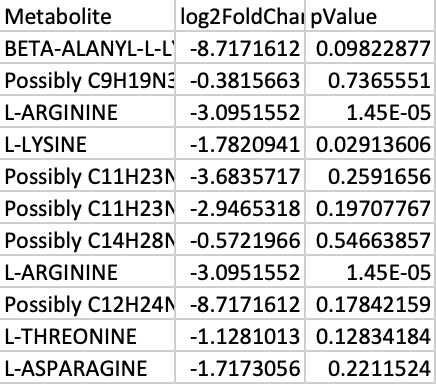
Create an excel spreadsheet showing the log transformed p values and fold changes. To transform the p values, use the equation below. This takes into account the fact that negative values and zeros often exist in the data. For the fold changes, take the Log base 2 , and for the p values, take the Log base 10. In this equation, a represents a constant and x represents the value of interest. An example to the right shows the transformed sample data.
-
Save the excel file of the transformed data as a CSV file.
-
Upload the data into R. The code used to generate the volcano plot is found below
library(readr)
X_v_G_for_Volcano_Plot <- read_csv("Desktop/PXE_Leila/X v G for Volcano Plot.csv")
View(X_v_G_for_Volcano_Plot)


# Make a basic volcano plot
with(X_v_G_for_Volcano_Plot, plot(log2FoldChange, -log10(pValue), pch=20, main="G v X Volcano Plot"))

# Add colored points: red if padj<0.05, orange of log2FC>1, green if both)
with(subset(X_v_G_for_Volcano_Plot, pValue<.05 ), points(log2FoldChange, -log10(pValue), pch=20, col="red"))
with(subset(X_v_G_for_Volcano_Plot, abs(log2FoldChange)>1), points(log2FoldChange, -log10(pValue), pch=20, col="orange"))
with(subset(X_v_G_for_Volcano_Plot, pValue<.05 & abs(log2FoldChange)>1), points(log2FoldChange, -log10(pValue), pch=20, col="green"))

# Label points with the textxy function from the calibrate plot
library(calibrate)
with(subset(X_v_G_for_Volcano_Plot, pValue<.05 & abs(log2FoldChange)>1), textxy(log2FoldChange, -log10(pValue), labs=Metabolite, cex=.2))
- Modify the code to include the correct file path and variable names.
- Line 11 specifies that points with a pValue less than 0.05 only should be red
- Line 12 specifies that points with an abs(logFC) greater than 1 should be orange
- Line 13 specifies that points with an abs(logFC) greater than 1 and a pValue less than 0.05 should be colored green.
- Line 17 adds labels to the green dots.