LION
Often times, there are tools specific to lipidomics that can be used to produce meaningful insights. After raw data has been analyzed using LipidSearch, individual lipid names and concentrations can be passed through the LION™ Lipid Ontology online software to map lipids based on their distinct characteristics. The program works by grouping lipid names based on their distinct characteristics (ex. Found in the mitochondria, above average bilayer thickness, etc.). Here are the steps to work with this program:
- Upload normalized data into the program. YOU DON’T HAVE TO LOG TRANSFORM. It does it automatically. You want to upload the file with the distinct lipid names, not a file containing averaged and grouped lipid type. I.e. d18:1 sphingosine instead of “sphingosines”
- Pick the test statistic you want to use to analyze your data.
- For binomial classes, pick either the one way t-test or log2Fold Change
- For polynomial classes, pick the one-way ANOVA
- Set the conditions of interest
- Click “calculate local statistics”
- Click “Use values as local statistics”
- Click “Submit”
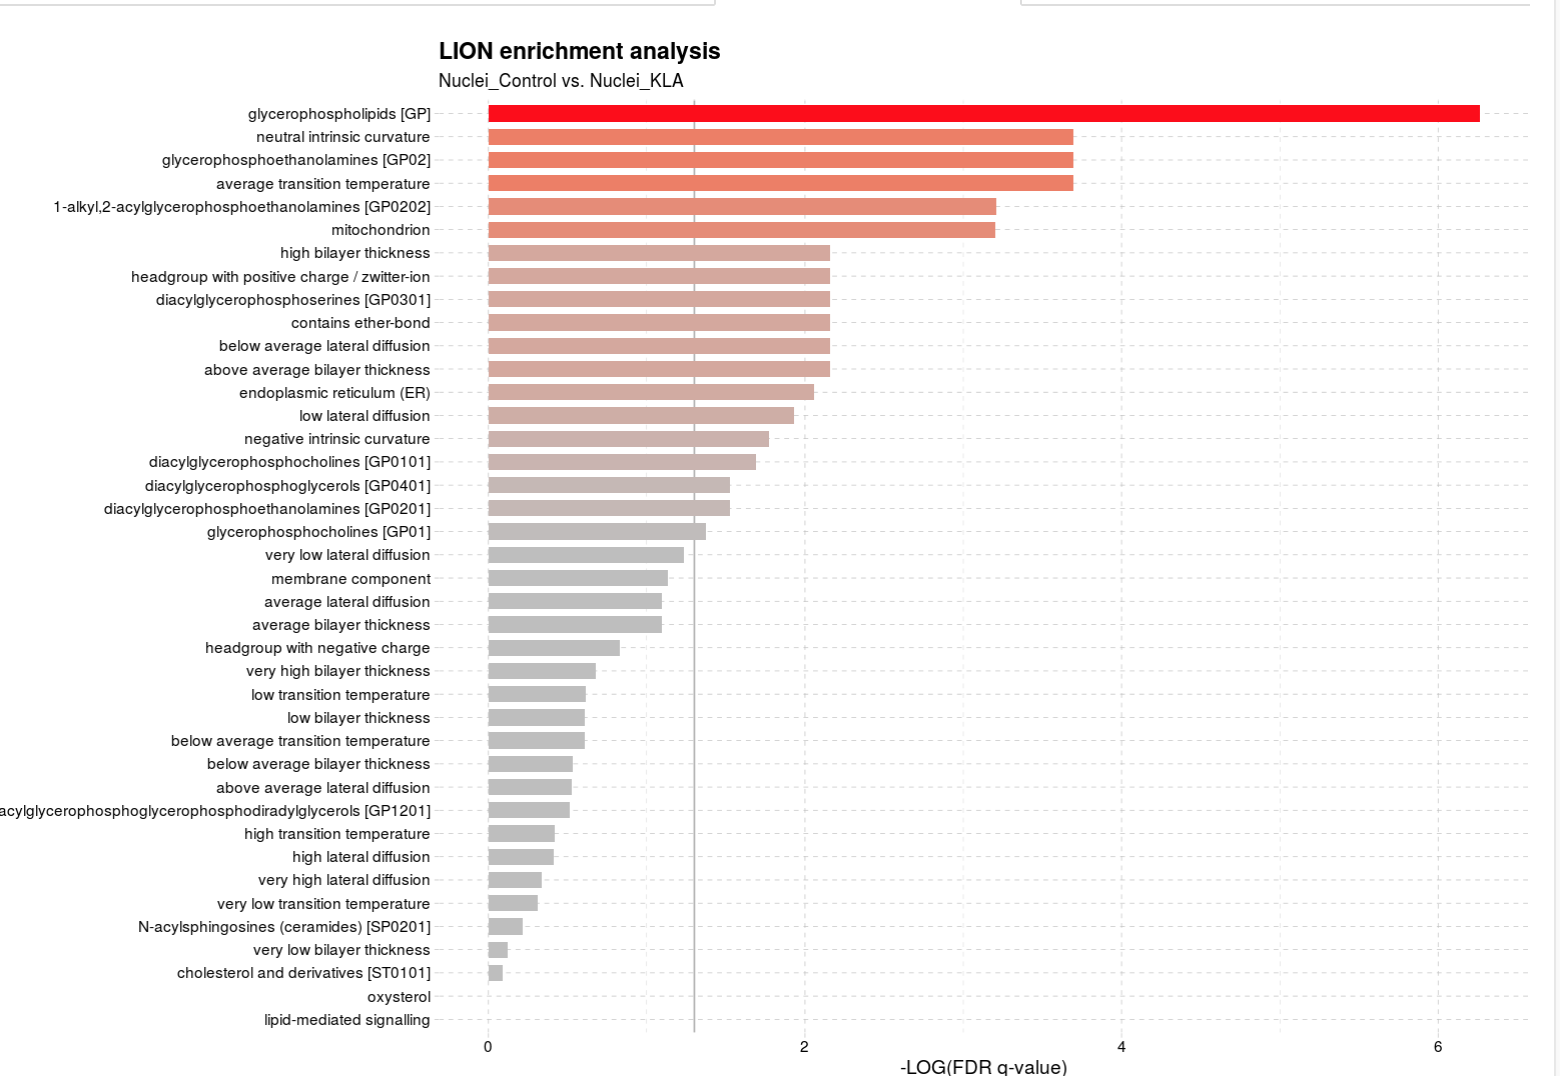
A graph showing the enrichment (with significant differences indicated by the q value (analgous to p value) is then generated. Here is an example below:
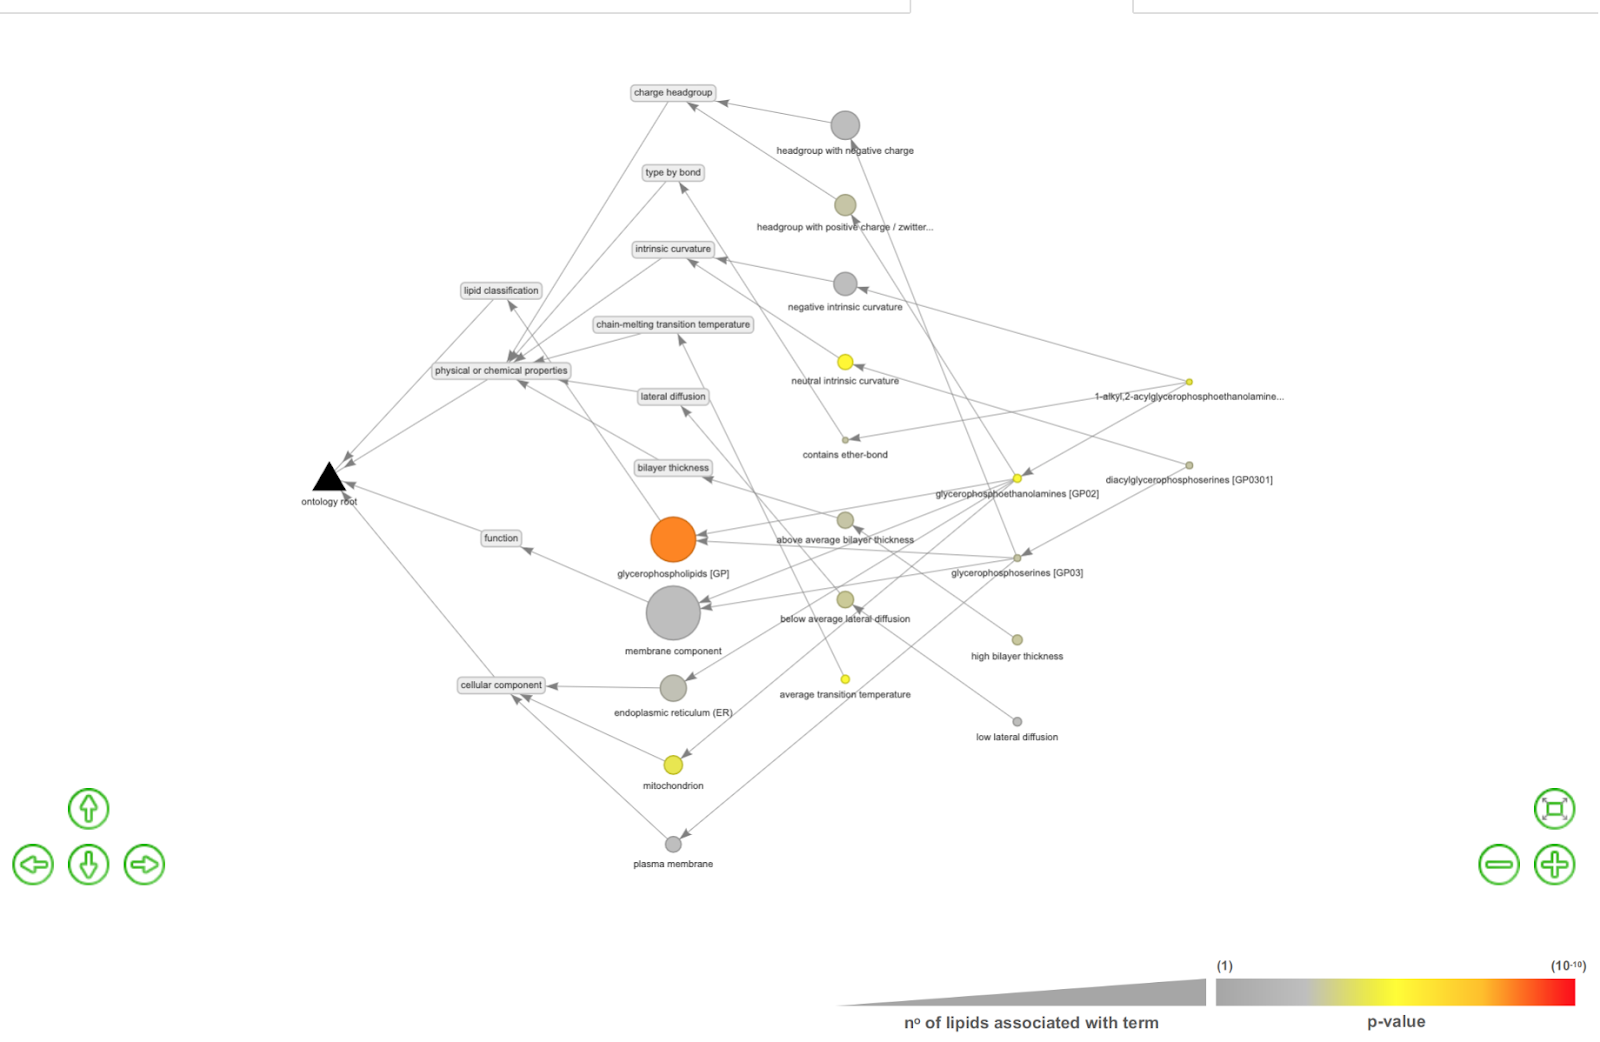
You can also further generate a lipid interaction network by clicking the LION Network View tab.
The edges and nodes represent interactions between different types of lipids
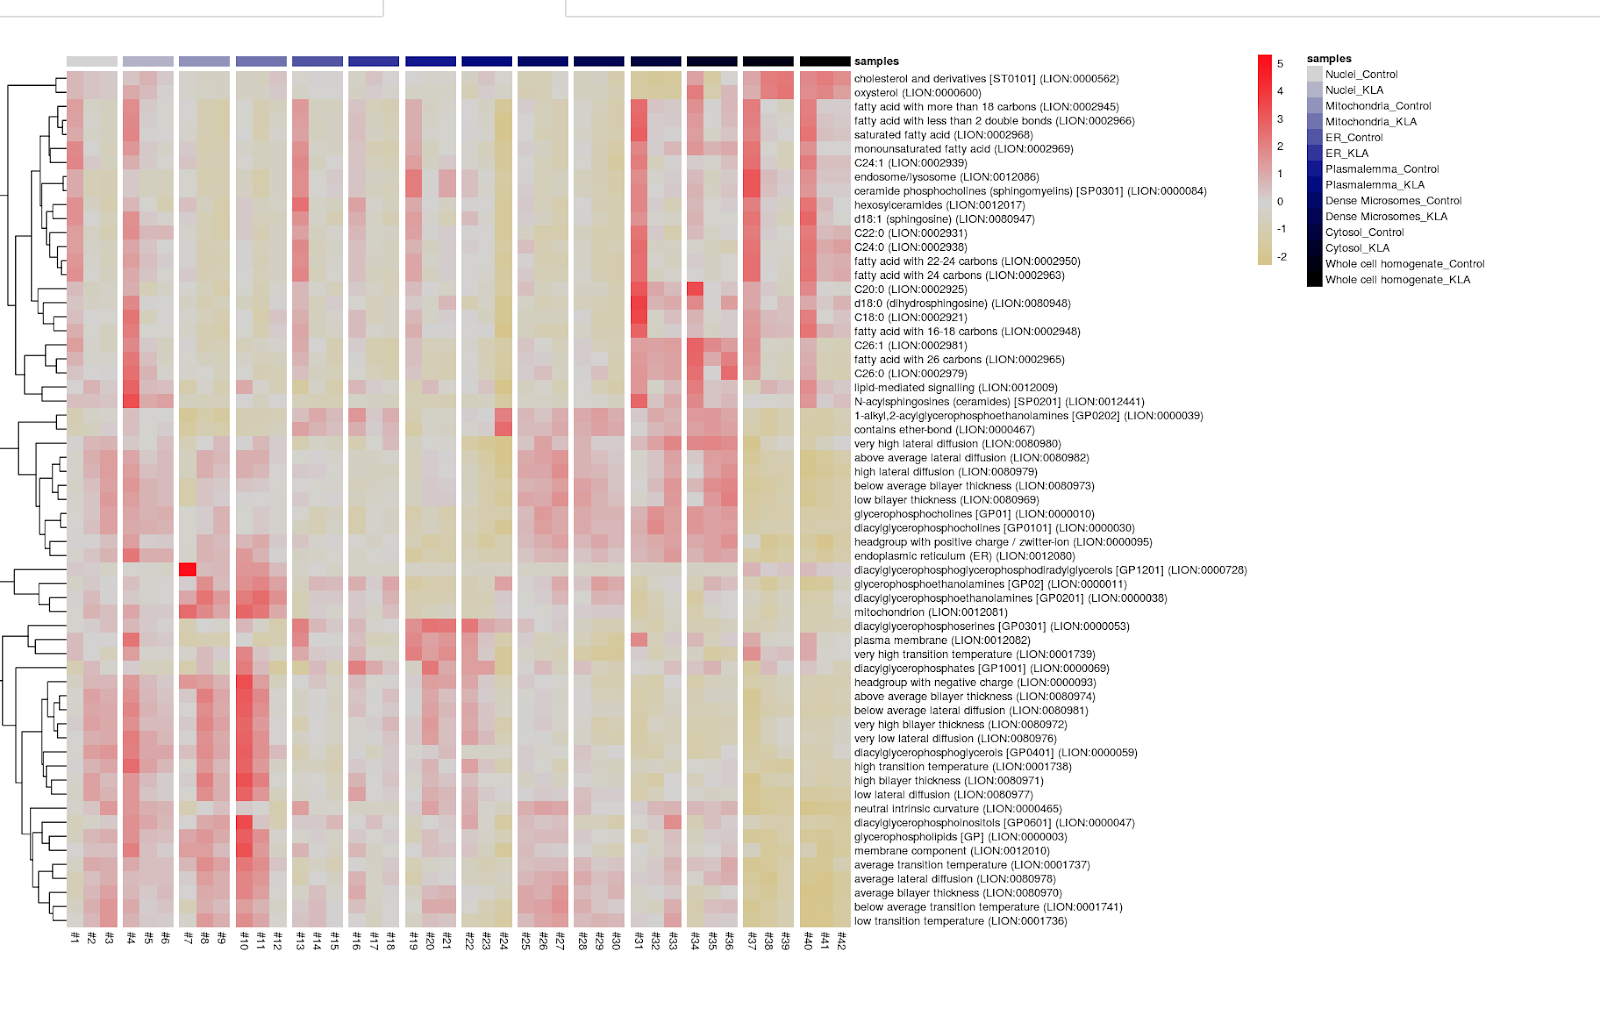
Finally, you can generate a heatmap showing the distribution of different lipid characteristics across samples.
- At the upper left hand corner click “LION PCA heatmap”
- Upload data as a CSV file. Make sure data is NOT log transformed.
- Set the number of principal components used (generally 2-3)
- You can either cluster by sample type or by lipid ontology terms.
Here is an example of the output: