Grouping data is often useful to distinguish that there is a significant difference between our treatment (and/or) control groups. There are three main ways of grouping data: Principal Component Analysis (PCA), Partial Least Squares Regression Discriminant Analysis (PLS-DA) and Heat Maps.
After you have normalized and transformed your data, the process of using these grouping methods is pretty simple.
PCA
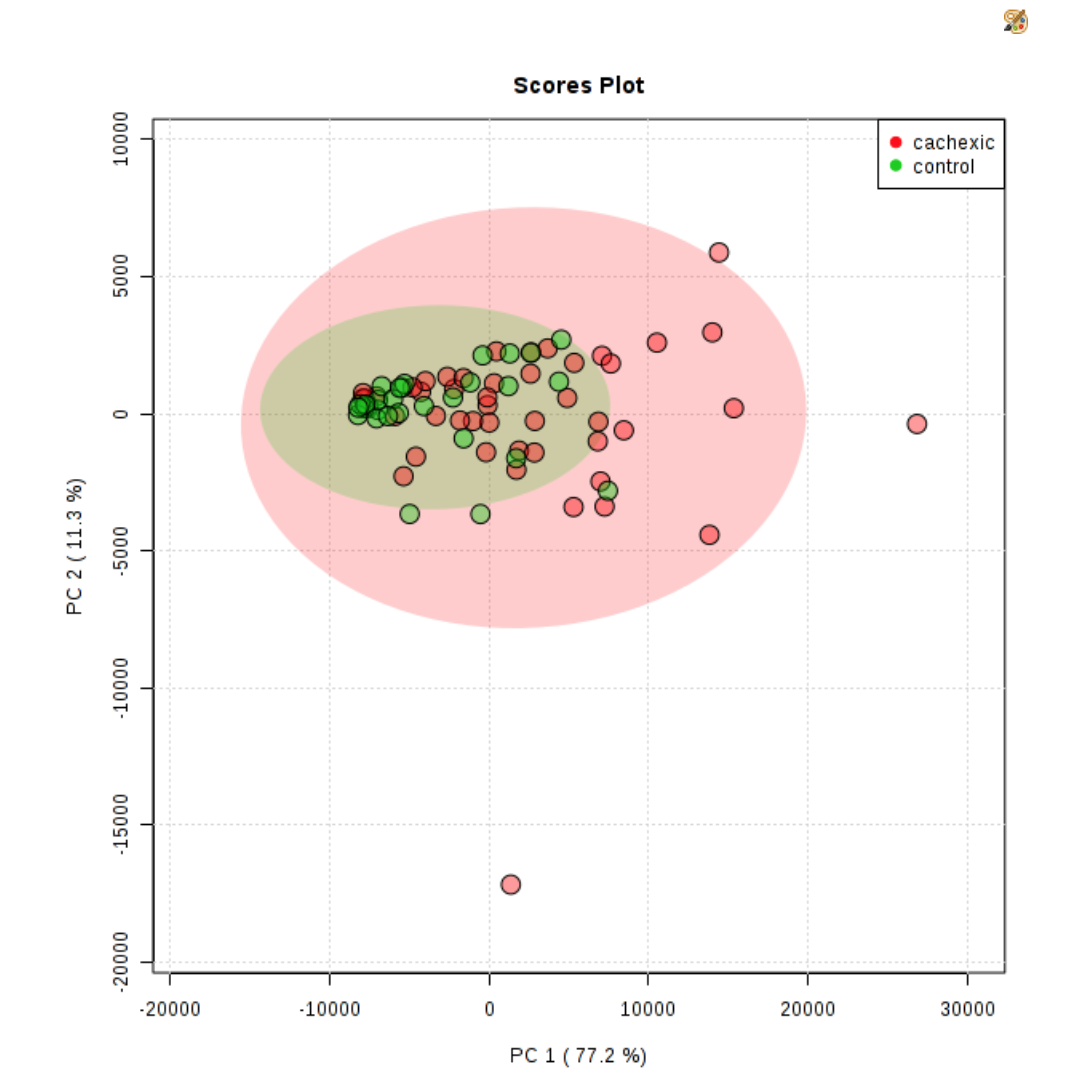 Principal Component Analysis (PCA) is a form of dimensionality reduction that reduces features of samples into principal components. The first two principal components helped to explain the percentage of variance between the two groups. When running a PCA in Metaboanalyst, just click on “PCA” on the lefthand side of the website after you’ve input and transformed your data. The first tab should say “Overview”
You’ll often see something like this on the right.
PLS-DA
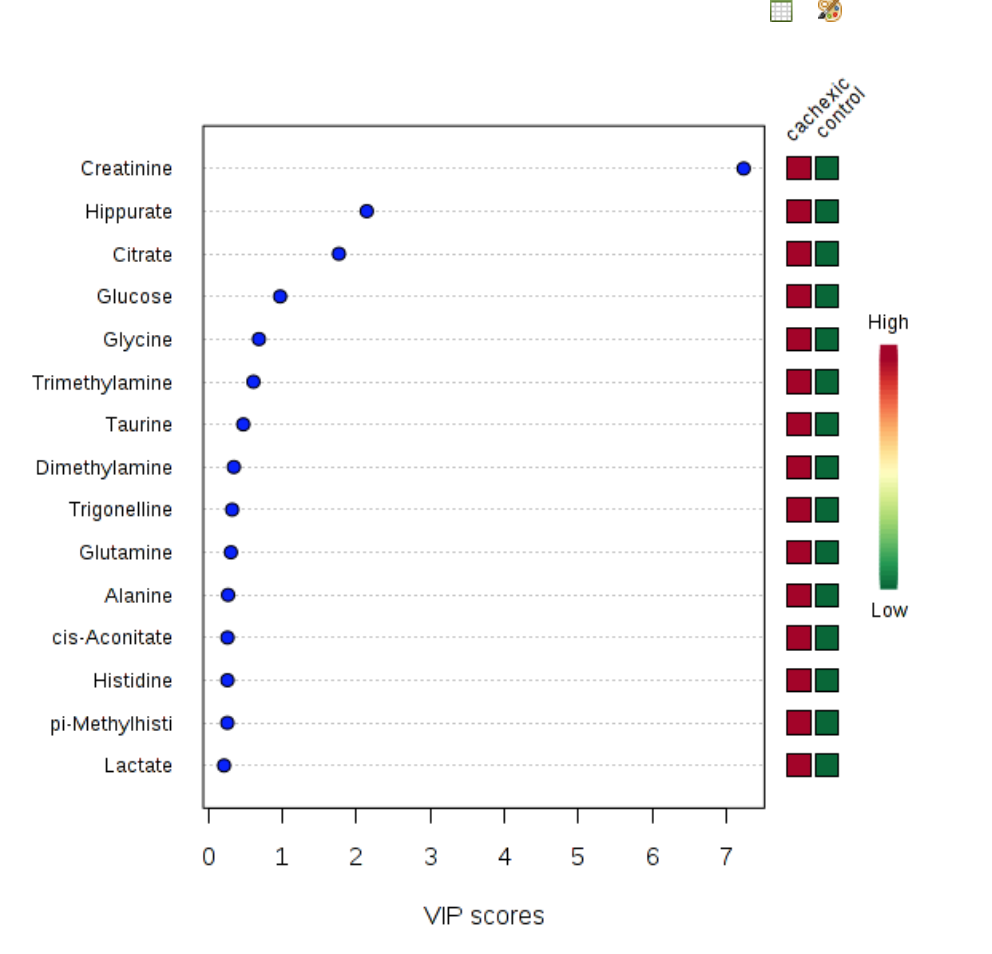 Partial Least Squares - Discriminant Analysis (PLS-DA) is a linear classification model used to classify a sample based on its attributes. It utilizes dimensionality reduction, along with discriminant analysis to group the samples into their respective classes. PLS-DA also generates a list of the attributes (metabolites) that scored highest in terms of variable importance in projection (VIP).
- Just go to the left hand tab and click “PLSDA”
- Again the first thing you’ll see in the overview tab is a matrix showing the grouping generated by each principal component
- Generate a 2-d scores plot again.
- This, time click the tab labeled “imp. Features” . This generates a plot showing the VIP scores for the compounds that add the most weight to the classification function.
Heat Map Generation
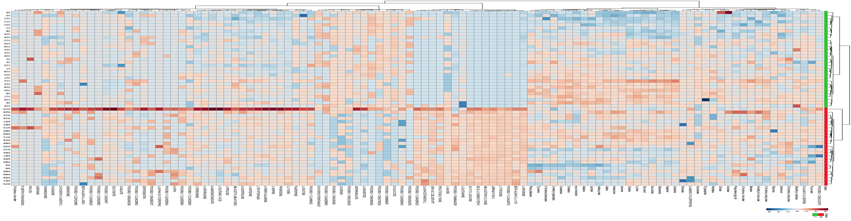
Another way of grouping data to ascertain patterns is to generate a heat map. Heatmaps compare the over and underexpression of genes/metabolites/lipids and create a matrix of each sample’s metabolite. The red colors indicate upregulation and blue colors indicate down regulation. Heat maps also identify patterns and groupings that can otherwise not be easily seen.
- In Metaboanalyst, go to the left hand side and click the “heat map” tab
- If your samples are not already automatically grouped based on sample type, click the “Do not reorganize” samples box.
- Click “detailed view” when working with many genes/metabolites/lipids
- You should then generate a heat map as exemplified by the one below: